
Football Guides
Football Statistics Explained
Football statistics count what happens in a match — shots, passes, tackles, possession — and help explain how a result came about. They are most useful in context: compared with the opponent, across several matches and alongside what actually happened on the pitch.
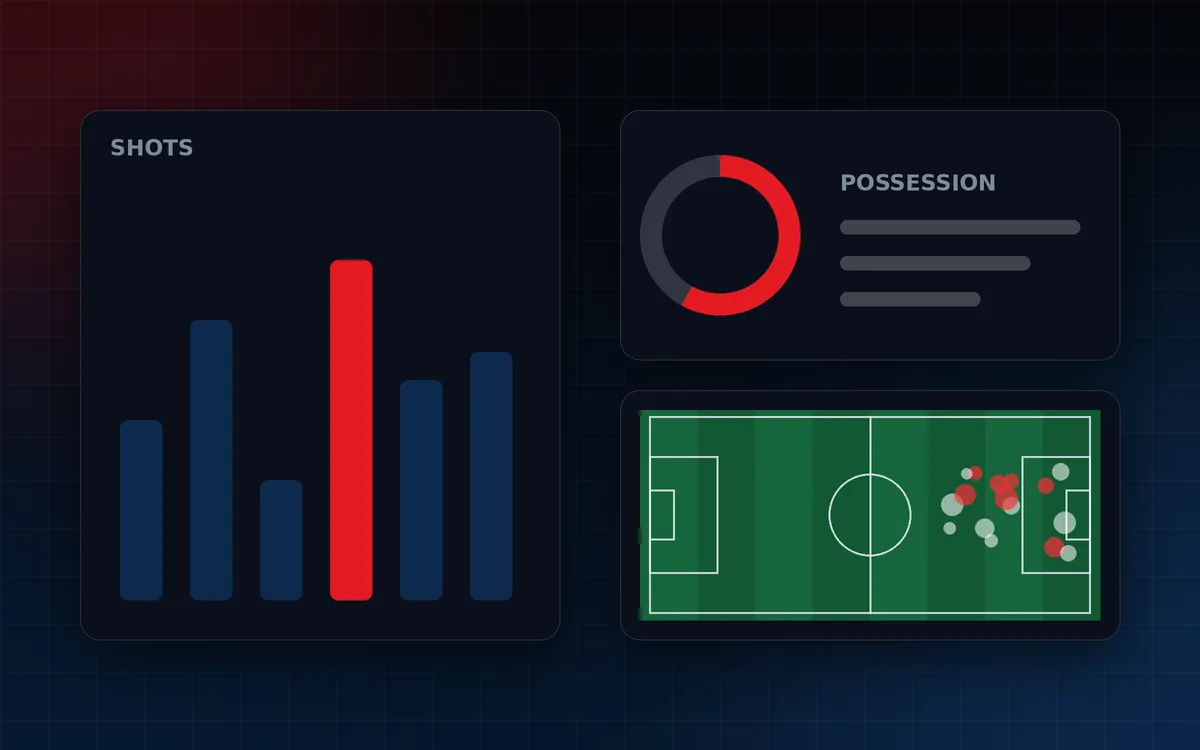
Reading a match stats sheet
A typical sheet compares both teams on possession, shots, shots on target, corners, fouls, cards and passes, and increasingly expected goals (xG). Each number is defined on the football statistics hub. Read it as a comparison: the gap between the two teams tells you more than any single figure.
Context matters
- Game state: a team leading early often gives up possession and defends; a trailing team pushes forward. Possession and shot counts reflect that.
- Red cards: playing with ten players changes almost every statistic.
- Opposition: the same numbers mean different things against a strong or weak opponent.
Per-90 and rate statistics
To compare players with different playing time, statistics are often expressed per 90 minutes. A player with 4 goals in 540 minutes has scored 4 ÷ 540 × 90 = 0.67 goals per 90. Rates such as pass completion (successful passes ÷ attempted passes) help compare players in similar roles.
Expected goals (xG) in practice
An xG model estimates each shot's chance of being scored, based on factors such as distance, angle and type of chance. A shot with an xG of 0.10 is scored about one time in ten from similar situations. Adding a team's shot values gives its xG for the match.
| Shot (fictional example) | xG |
|---|---|
| Penalty | About 0.76–0.79 in many models |
| Close-range header from a cross | 0.20 |
| Shot from the edge of the box | 0.05 |
| Total | About 1.03 |
A team with 1.03 xG would, on average, score about one goal from those chances. xG describes chance quality; it does not replace the actual score.
Sample size
One match is a small sample. Statistics become more meaningful across several matches or a season, because randomness — a deflection, a great save — evens out over time.
Common mistakes
- Treating possession as proof of dominance.
- Comparing totals without adjusting for minutes or matches played.
- Comparing xG figures from different providers as if they were the same model.
- Using statistics as predictions. They describe what happened; they do not guarantee what happens next.